Visualizing the Urban Pulse
How data visualization tools are helping us see the invisible rhythms of human city life.
Patterns in the Static
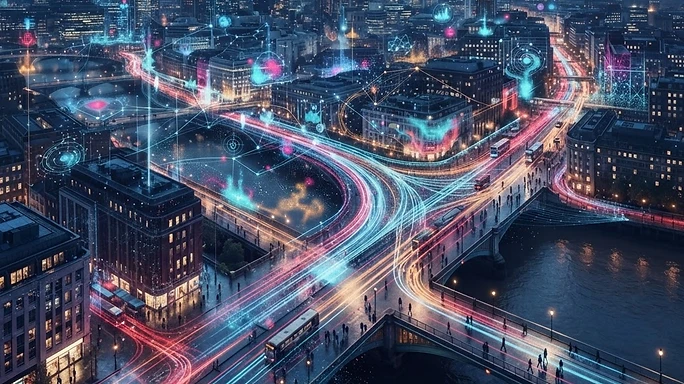
Data visualization acts as a lens. When we view the static map of a city, we see buildings and streets; when we view the dynamic data pulse, we see a living, breathing organism of movement and energy.
Mapping Human Behavior
By layering heat maps of human activity over architectural blueprints, we can identify bottlenecks in urban flow. This visual approach allows us to solve problems—like overcrowding or transit failures—before they impact the population at large.
The Aesthetics of Information
There is beauty in the data. Seeing a metropolis light up during a morning commute or dim as the world sleeps offers a perspective that humans have never had before in history. It connects us to the sheer scale of our existence.
Designing for Flow
Our design philosophy is shifting to match these visualizations. We are creating flexible spaces that can expand and contract based on the real-time needs of the people using them. It is the marriage of data and architecture.
A Shared Vision
As you browse our live dashboard, consider the visual data not just as a set of statistics, but as a roadmap for the future. We are learning how to inhabit our planet with greater awareness, and that starts with seeing the pulse of the crowd.